Fixing the Rating Curve for USGS Gage #11274790
Recalibration of a High-Discharge Wilderness Rating Curve Using NASA Airborne Snow Observatory SWE Maps to Fix the Relative Subbasin Water Balance in the Tuolumne River Headwaters
Elijah Boardman, Carl Renshaw, Evan Dethier (Department of Earth Sciences, Dartmouth College); Bruce McGurk (McGurck Hydrologic); Joseph Boardman (Analytical Imaging and Geophysics); with thanks to Airborne Snow Observatories science team.
Recent research indicates a discrepancy in the water balance for the catchment above USGS 11274790 TUOLUMNE R A GRAND CYN OF TUOLUMNE AB HETCH HETCHY, suggesting that the rating curve for this gage may under-report runoff at high stage. This page provides an explanation of the issue; sample revised rating and discharge data can be downloaded at the links below.
Contact eli.boardman@mountainhydrology.com for more information.
Abstract
Constructing a relative time-dependent water balance for the headwaters subbasin of the Hetch Hetchy Reservoir drainage area reveals a discrepancy between the distribution of snow water equivalent (SWE) and reported stream discharge. Due to the location of the headwaters gage in the Yosemite Wilderness, the gage’s current rating curve was generated through hydraulic analysis of survey-derived cross-sections instead of traditional trolley-based direct discharge measurements. Past studies have postulated that differential precipitation distribution could explain the relatively low runoff from the headwaters basin compared to reservoir inflows accumulating from the full basin. However, we use high spatial resolution maps of SWE measured over 7 yearly campaigns by the NASA/JPL Airborne Snow Observatory (ASO) to determine that snow loading in the headwaters subbasin is approximately proportional to its total area, suggesting that differential precipitation does not account for the relative water balance discrepancy. Hence, we encounter a problem of water mass conservation, suggesting that the gage underreports net discharge. We identify periods of roughly equal snowmelt and reservoir inflow to reconstruct proxy high-stage discharge values during portions of the 2013–2019 melt seasons. We combine the SWE proxies with the original stage record and low-stage field measurements from the U.S. Geological Survey (USGS) to optimize a new power-law rating curve which reduces the mean melt-season error in our relative mass-balance model to 6%, as compared to 40% error using current discharge values over the same timeframe. Thus, we demonstrate a new method for calibrating high-stage flows at the Tuolumne headwaters gage by comparing distributed SWE maps with known reservoir inflows. Validation of the recalibrated rating curve also reveals the importance of temperature-isotherm hypsometry for driving the seasonal dependence of relative subbasin water balances.
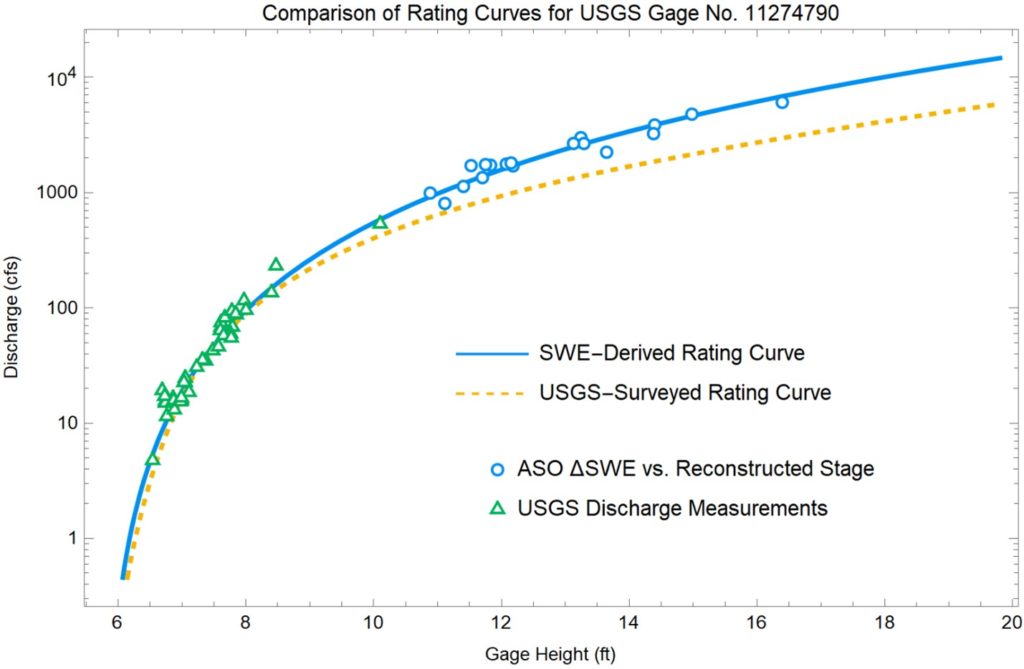
Comparison of SWE-derived* and USGS-surveyed rating curves
* Note that in all cases the “SWE-derived” rating curve was created using both SWE measurements and low-stage USGS discharge measurements.
The green points represent USGS field discharge measurements and corresponding stage, and the blue points represent ASO SWE-loss measurements between selected flight intervals plotted against implied constant stages reconstructed as roots of the rating curve for the modeled net discharge (not to be confused with the actual average stages, since the stage-discharge relationship is nonlinear). We use the SWE changes and the USGS low-stage discharge data to fit a power law to these data, creating a new rating curve. The USGS-surveyed rating curve is plotted in yellow, with the proposed new rating curve plotted in blue. Both rating curves are similar in the low-flow regime, but deviate substantially at high stage. Note the log scaling of the discharge axis—the rating curves differ by more than 100% for stages above 14 feet. The maximum recorded stage between water years 2013–2020 was 19.8 feet, at which level the rating curves differ by 150%. To demonstrate the stability of the SWE-derived rating model, the jacknife resampled rating curves (Table 2) fit approximately within the thickness of the line.
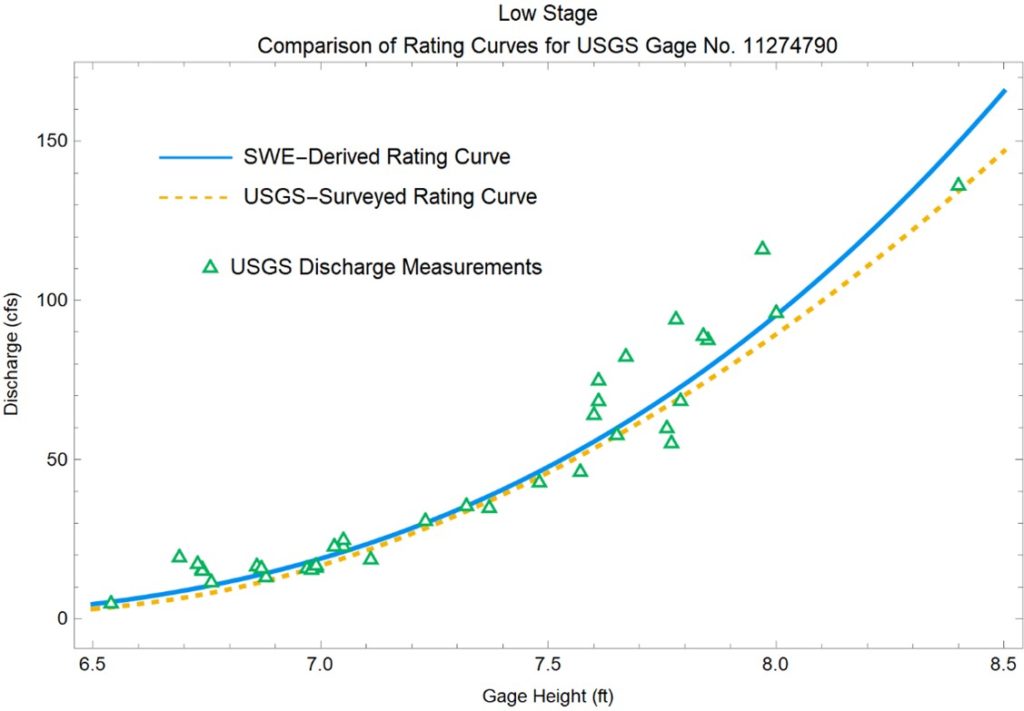
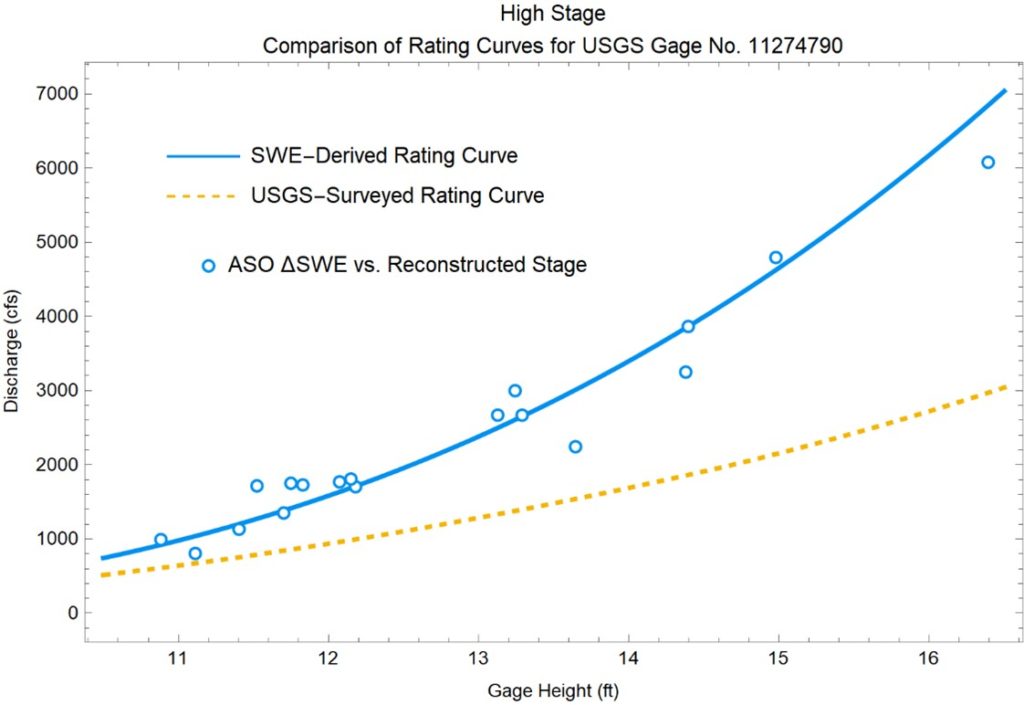
Comparison of rating curves at low and high stages
The panels show sections of the rating curves plotted with linear axes to emphasize agreement or discrepancy. The SWE-derived and USGS-surveyed rating curves are similar in the range of the low-stage USGS discharge measurements (upper panel). The SWE-derived curve indicates high-stage discharge levels roughly twice as large as the surveyed rating curve (lower panel), causing the SWE-derived curve to diverge from the surveyed curve at high stage.
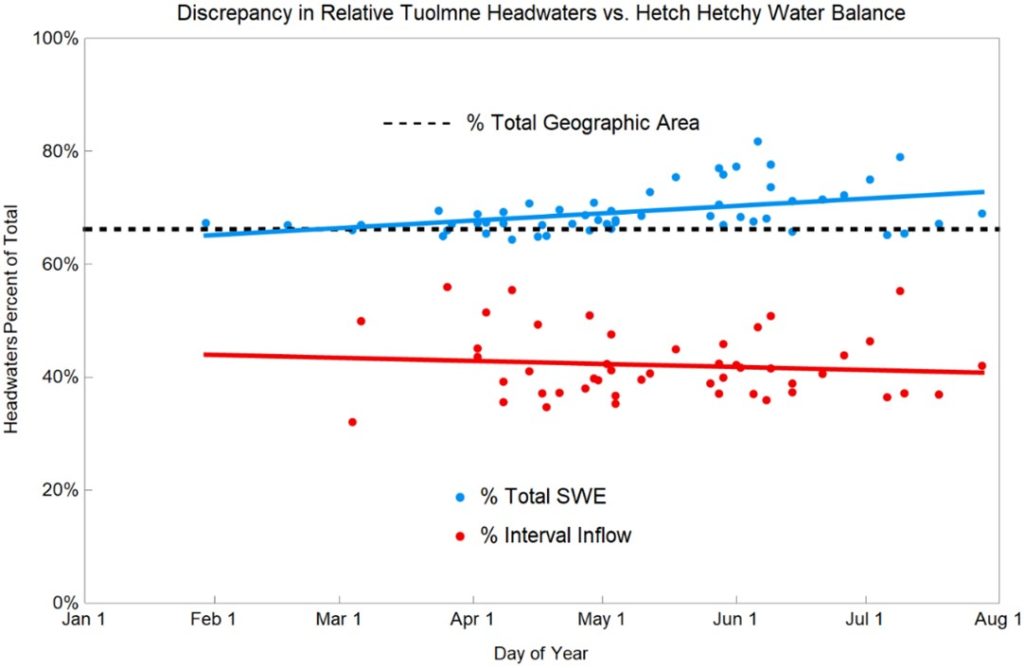
Discrepancy in relative balances of SWE and runoff for the headwaters subbasin
The proportion of total full basin SWE located in the headwaters subbasin is plotted in blue, showing that the headwaters snow loading is approximately proportional to its geographic area (dashed line) in the early season and slightly increases later. The proportion of reservoir inflow reported by the headwaters gage during inter-flight SWE measurement intervals is plotted in red, showing a much lower mean and opposite trend compared to the relative snow distribution. We interpret this as a water balance discrepancy.
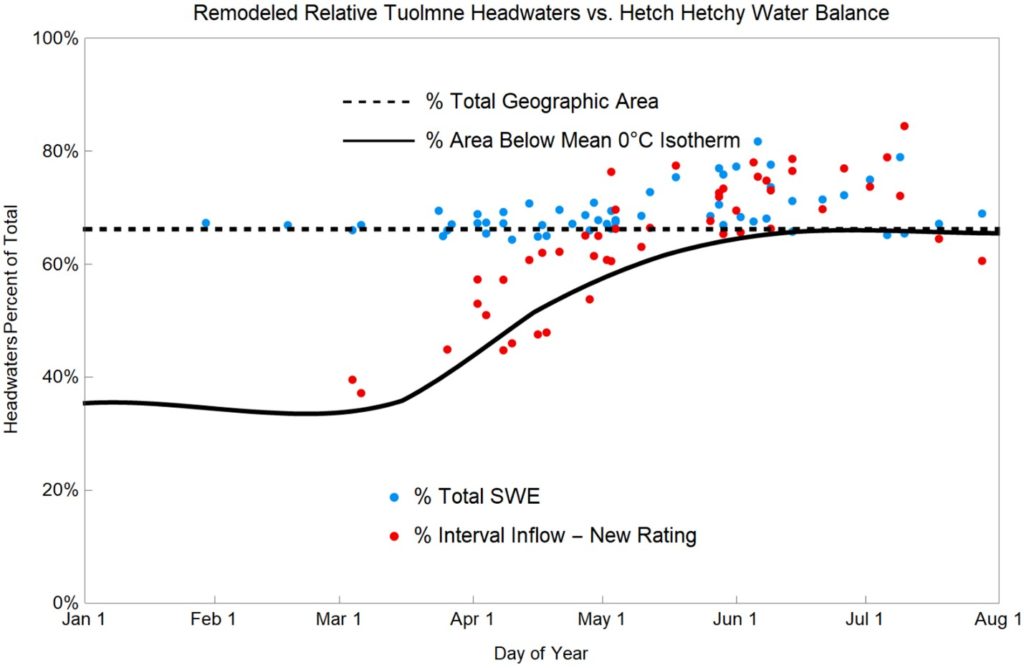
Re-modeled relative balances of SWE and runoff for the headwaters subbasin
The relative SWE content of the headwaters subbasin (blue points) is roughly proportional to its fractional geographic area compared to the full Hetch Hetchy Reservoir drainage area (dashed line). In the later season, the headwaters subbasin includes slightly above-average SWE due to its slightly higher elevation. However, the relative integrated discharge values between each ASO flight (red points) show that the headwaters subbasin produces relatively little water early in the season. The seasonal dependence of relative headwaters runoff aligns with the interpolated relative mean unfrozen area in the subbasin (solid line), which we derive from a freezing elevation isotherm using basin hypsometry.
Compare to left panel.
References
Boardman, E., Dethier, E., Renshaw, C. (2021, unpublished). Unmixing the Impact of Total Moisture and Ecological Zone on Runoff Efficiency in the Upper Tuolumne River Basin
Using Reservoir Inflows and NASA Airborne Snow Observatory SWE Maps. Dartmouth College Department of Earth Sciences, senior thesis. In progress.
California Department of Water Resources, DFM-Hydro-SMN (DWR). (2021). Meteorological Station Data and SNOTEL Data: TUM. 45-(daily)-PRECIPITATION, INCREMENTAL. 82-(daily)-SNOW, WATER CONTENT (REVISED). California Data Exchange Center (CDEC). Accessed 2021. https://cdec.water.ca.gov/dynamicapp/staMeta?station_id=TUM
City of San Francisco. (2021). Meteorological Station Data: HEM. Meteorological Station Data. California Data Exchange Center (CDEC). Accessed 2021. https://cdec.water.ca.gov/dynamicapp/staMeta?station_id=HEM
Conrad, O., Bechtel, B., Bock, M., Dietrich, H., Fischer, E., Gerlitz, L., Wehberg, J., Wichmann, V., and Bïchner, J. (2015): System for Automated Geoscientific Analyses (SAGA) v. 2.1.4, Geosci. Model Dev., 8, 1991-2007, doi:10.5194/gmd-8-1991-2015.
GDAL/OGR contributors (2021). GDAL/OGR Geospatial Data Abstraction software Library. Open Source Geospatial Foundation. https://gdal.org
Graham, C. (2018). ASO in the Tuolumne River Basin: Forecasting streamflow using basin wide SWE estimates (presentation). Yosemite Hydroclimate Meeting. https://www.cafiresci.org/events-webinars-source/category/yosemite-hydroclimate-meeting-2018
GRASS Development Team, (2017). Geographic Resources Analysis Support System (GRASS) Software, Version 7.2. Open Source Geospatial Foundation. Electronic document:. http://grass.osgeo.org
Hedrick, Andrew R., Danny Marks, Scott Havens, Mark Robertson, Micah Johnson, Micah Sandusky, Hans‐Peter Marshall, Patrick R. Kormos, Kat J. Bormann, and Thomas H. Painter. “Direct Insertion of NASA Airborne Snow Observatory‐Derived Snow Depth Time Series Into the ISnobal Energy Balance Snow Model.” Water Resources Research 54, no. 10 (2018): 8045–63. https://doi.org/10.1029/2018wr023190.
Henn, B., Painter, T. H., Bormann, K. J., McGurk, B., Flint, A. L., Flint, L. E., White, V., Lundquist, J. D. (2018). High-elevation evapotranspiration estimates during drought: Using streamflow and NASA airborne snow observatory SWE observations to close the upper tuolumne river basin water balance. Water Resources Research, 54,746–766. https://doi.org/10.1002/2017WR020473
MATLAB. (2020). R2020a. Natick, Massachusetts: The MathWorks Inc.
McGurk, B. (2021). General Discussion. Personal communication.
McGurk, B. (2021). Hetch Hetchy Reservoir Inflows. Personal communication.
Painter, T., Berisford, D., Boardman, J., Bormann, K., Deems, J., Gehrke, F., Hedrick, A., Joyce, M., Laidlaw, R., Marks, D., Mattmann, C., Mcgurk, B., Ramirez, P., Richardson, M., Skiles, S.M., Seidel, F., and A. Winstral (2016): The Airborne Snow Observatory: fusion of scanning lidar, imaging spectrometer, and physically-based modeling for mapping snow water equivalent and snow albedo. Remote Sensing of Environment. DOI: 10.1016/j.rse.2016.06.018
Painter, T., et al. (2019). ASO L4 Lidar Snow Water Equivalent 50m UTM Grid, Version 1. Tuolumne Basin. Boulder, Colorado USA. NASA National Snow and Ice Data Center Distributed Active Archive Center. doi: https://doi.org/10.5067/M4TUH28NHL4Z. Accessed 2021.
Painter, T. H., K. J. Bormann, et al. (2020). ASO L4 Lidar Point Cloud Digital Terrain Model 3m UTM Grid, Version 1. Tuolumne Basin. Boulder, Colorado USA. NASA National Snow and Ice Data Center Distributed Active Archive Center. doi: https://doi.org/10.5067/2EHMWG4IT76O. Accessed 2021
QGIS.org (2021). QGIS Geographic Information System. QGIS Association. http://www.qgis.org
Rantz, S.E. (1982). Measurement and computation of streamflow. U.S. Geological Survey Water-Supply Paper 2175, p. 631. Reston, Virginia.
U.S. Geological Survey (2021). Stage Data, Field Measurement Data, and Rating Curve for Gage Number 11274790. Accessed 2021. https://waterdata.usgs.gov/nwis/inventory/?site_no=11274790&agency_cd=USGS, https://waterdata.usgs.gov/nwis/inventory/?site_no=11275500&agency_cd=USGS.
Wolfram Research, Inc., (2020). Mathematica, Version 12.2, Champaign, IL.